
We’ve mashed up the data we obtained last summer in the survey and compare the near misses pinned on the interactive survey map with actual reported incidents.
The collision data is to 2022 (derived from publicly available statistics similar to those recorded by Crashmap. We downloaded the latest snapshot from the Bikedata project from 1999 to 2022.)
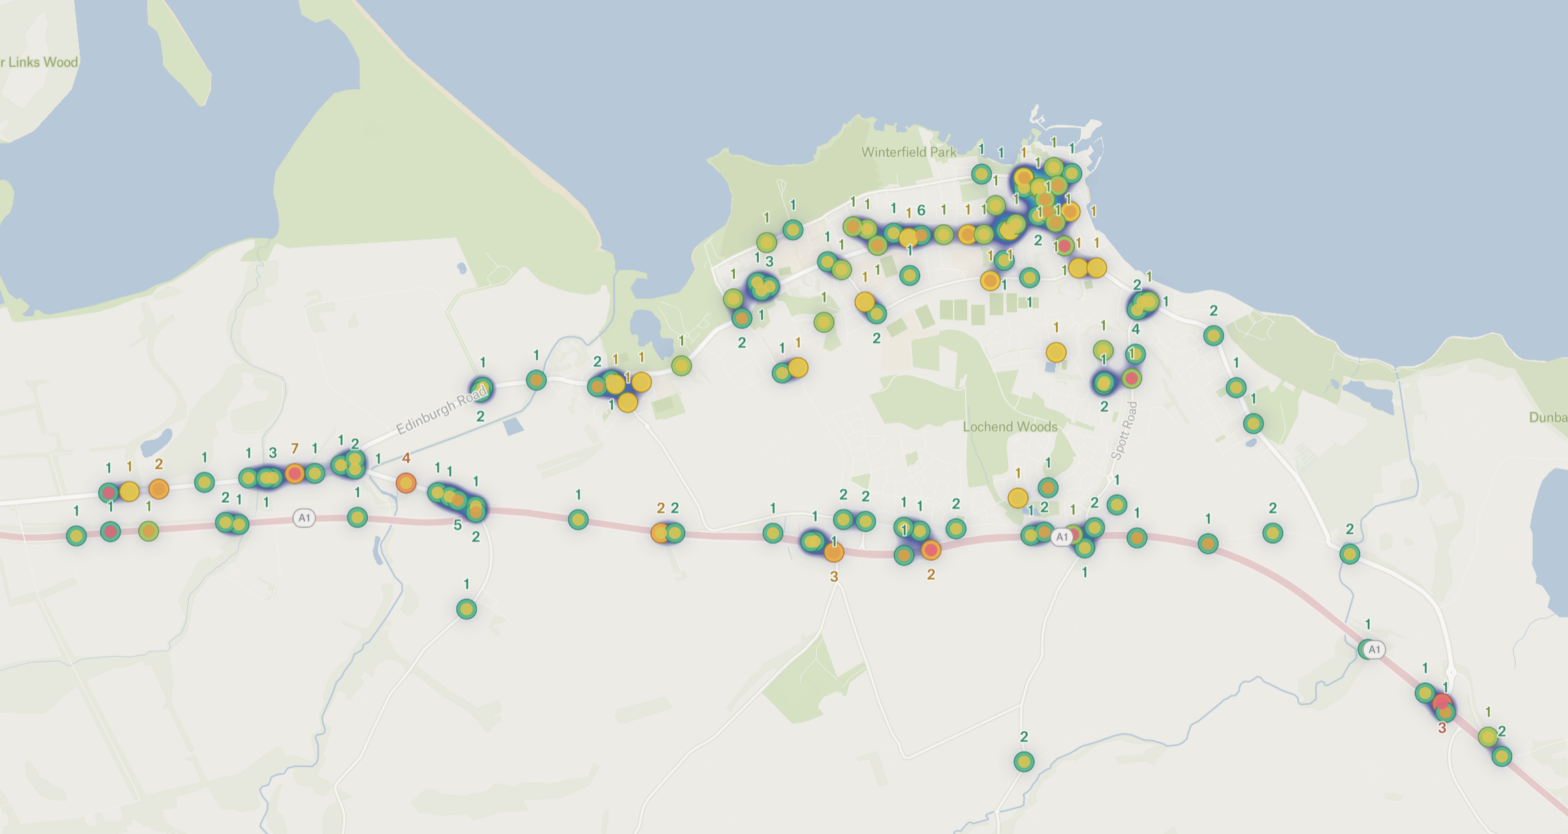
You can show and hide the data sets and zoom in and out flexibly to identify hotspots.
It is obvious that the main thoroughfares have more accidents, which coincides with generally higher speeds and higher flows. There are more incidents at junctions and crossings.
The main roads are more direct, but not always as pleasant as the indirect routes, but in some cases there aren’t obvious alternatives or the main alternative circuitous.
One take away point is that areas that are seemingly free of accidents, still don’t feel safe.
Interventions are justified on safety grounds, but an accident must usually happen before any action is taken. Maybe that is the wrong way to look at the problem, if the objective is to encourage more people to get out and about instead of taking the car.
But draw your own conclusions.