
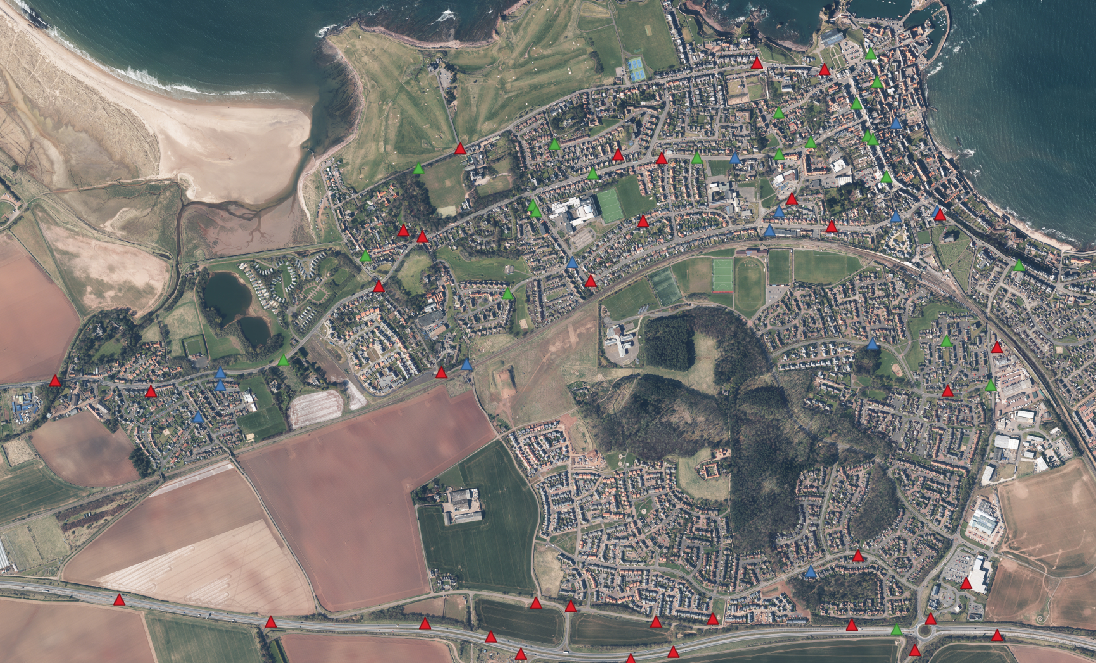
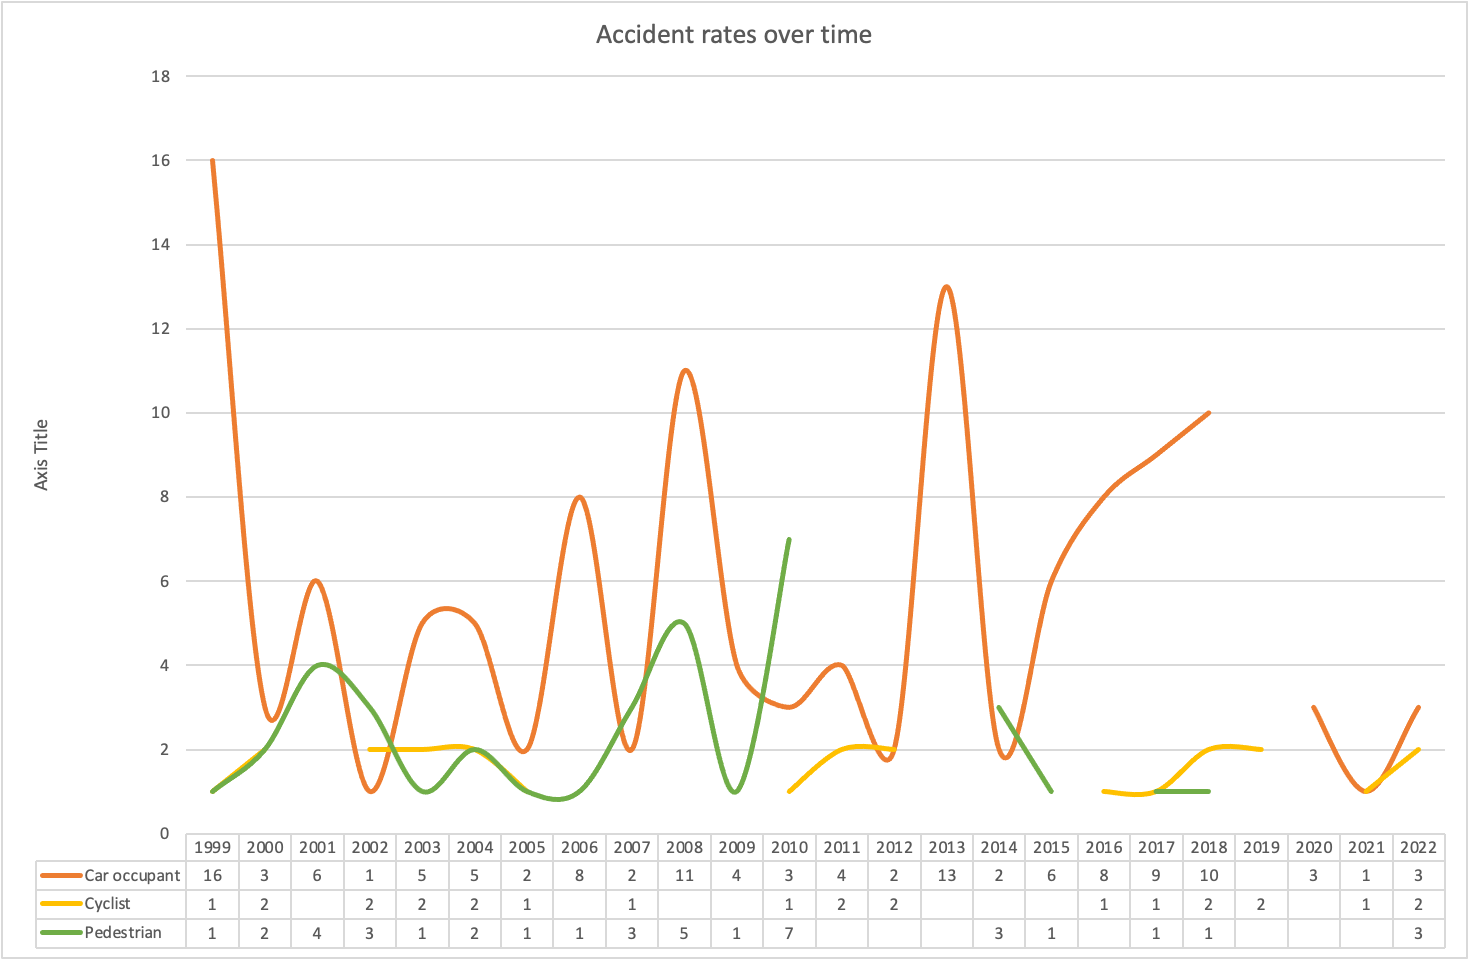
These data are courtesy of Bike Data Cycle Streets, which we have classified by severity (slight,serious,or fatal). Below we’ve tabulated the results by year.
Number of Casualties in West Barns & Dunbar since 1999
| Year | Car occupant | Cyclist | Pedestrian | Total |
| 1999 | 16 | 1 | 1 | 18 |
| 2000 | 3 | 2 | 2 | 7 |
| 2001 | 6 | 4 | 10 | |
| 2002 | 1 | 2 | 3 | 6 |
| 2003 | 5 | 2 | 1 | 8 |
| 2004 | 5 | 2 | 2 | 9 |
| 2005 | 2 | 1 | 1 | 4 |
| 2006 | 8 | 1 | 9 | |
| 2007 | 2 | 1 | 3 | 6 |
| 2008 | 11 | 5 | 16 | |
| 2009 | 4 | 1 | 5 | |
| 2010 | 3 | 1 | 7 | 11 |
| 2011 | 4 | 2 | 6 | |
| 2012 | 2 | 2 | 4 | |
| 2013 | 13 | 13 | ||
| 2014 | 2 | 3 | 5 | |
| 2015 | 6 | 1 | 7 | |
| 2016 | 8 | 1 | 9 | |
| 2017 | 9 | 1 | 1 | 11 |
| 2018 | 10 | 2 | 1 | 13 |
| 2019 | 2 | 2 | ||
| 2020 | 3 | 3 | ||
| 2021 | 1 | 1 | 2 | |
| 2022 | 3 | 2 | 3 | 8 |
| Total | 127 | 25 | 40 | 192 |
You must be logged in to post a comment.