
There is a useful tool in the Public Life Survey toolkit called “People Moving”. This tool is a rapid assessment of people either walking or cycling or running or wheeling or somehow supported (young and wheelchair).
It is useful in contexts where public space is being re-engineered to remove barriers, improve people flows and perhaps create areas for mingling and social interaction etc. As the technique is time intensive and data needs to be coded, it is not especially efficient and relies usually on student or other volunteers to gather the data. It is also relevant to active travel.
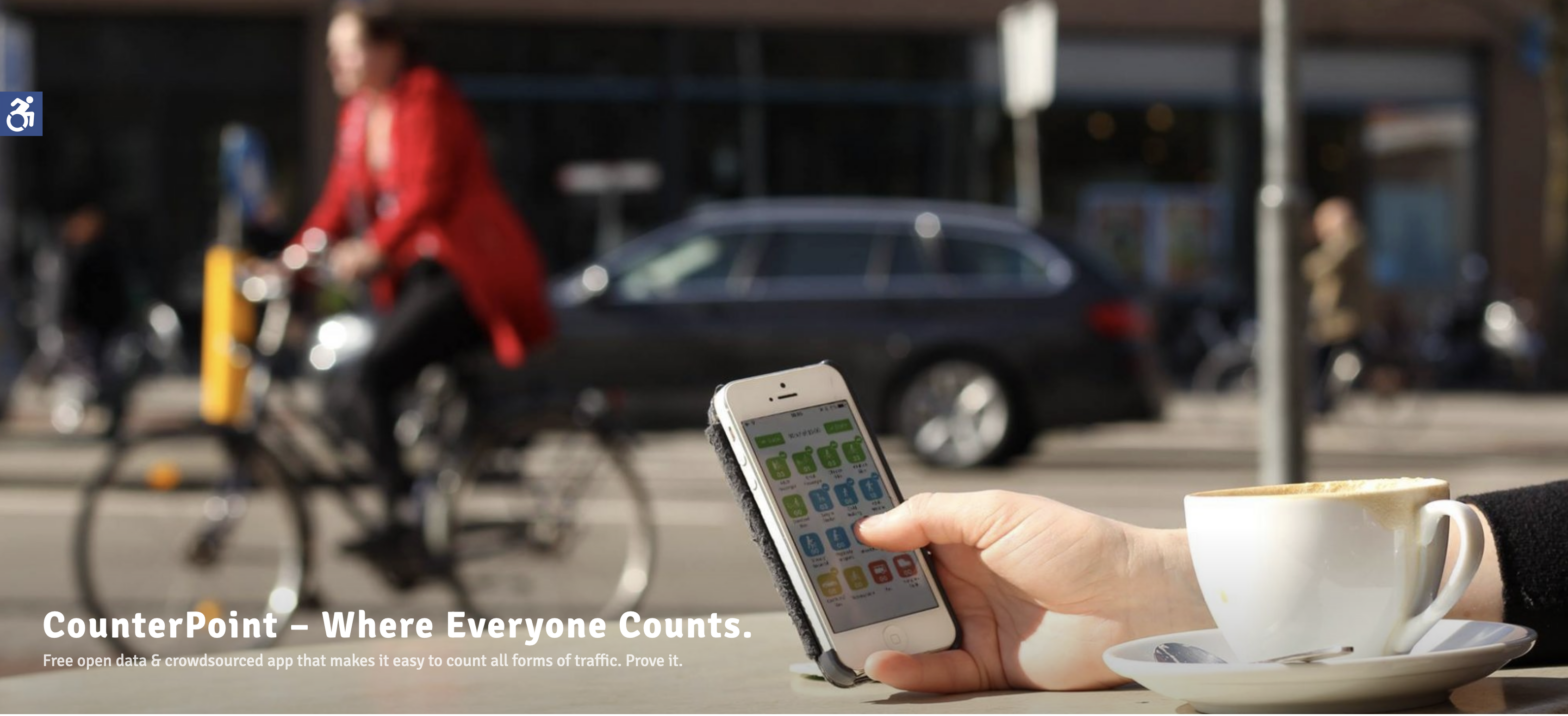
We have found a similar tool, which we felt fitted our research question better, which is to measure the split between active travel modes and motorised transport, which traditionally preoccupies transport planners. We use a simple phone app called counterpoint.app, which can be used by anyone.
CounterPoint is labelled as a general Public Life Survey tool. It is distinctive in that it crowdsources data using a citizen science approach, doesn’t collect potentially identifiable personal information and can be used to simply test a theory, gather evidence a problem or provide a baseline for monitoring.
It is highly transparent, simple and comparable with commercial automatic count tools. Unlike Telraam it is completely free and anyone can download the tool to their phone or an ipad and export data collected to a spreadsheet with minute-by-minute record of the counts done at a particular location.
Also an engineer or a planner can verify data easily (to address a complaint) by simply viewing it or doing an independent count themselves – further adding to the history of counts at a given location.
Users can join a survey team and count locations identified previously or create their own survey points.
The toolset includes: Regular Traffic Count (full mode survey); the Easy Traffic Count (4 modes); Car Occupancy Count (e.g. 1,2,3,4+); Bicycle Gender Count; Stationary Activity Survey (very similar to the Gehl Public Life Tool); Building Types Survey; Bike Racks Survey (# and #occupied).
We have deployed the Easy traffic count as we quickly found that it was harder to enumerate accurately at peak times if using the full survey method.
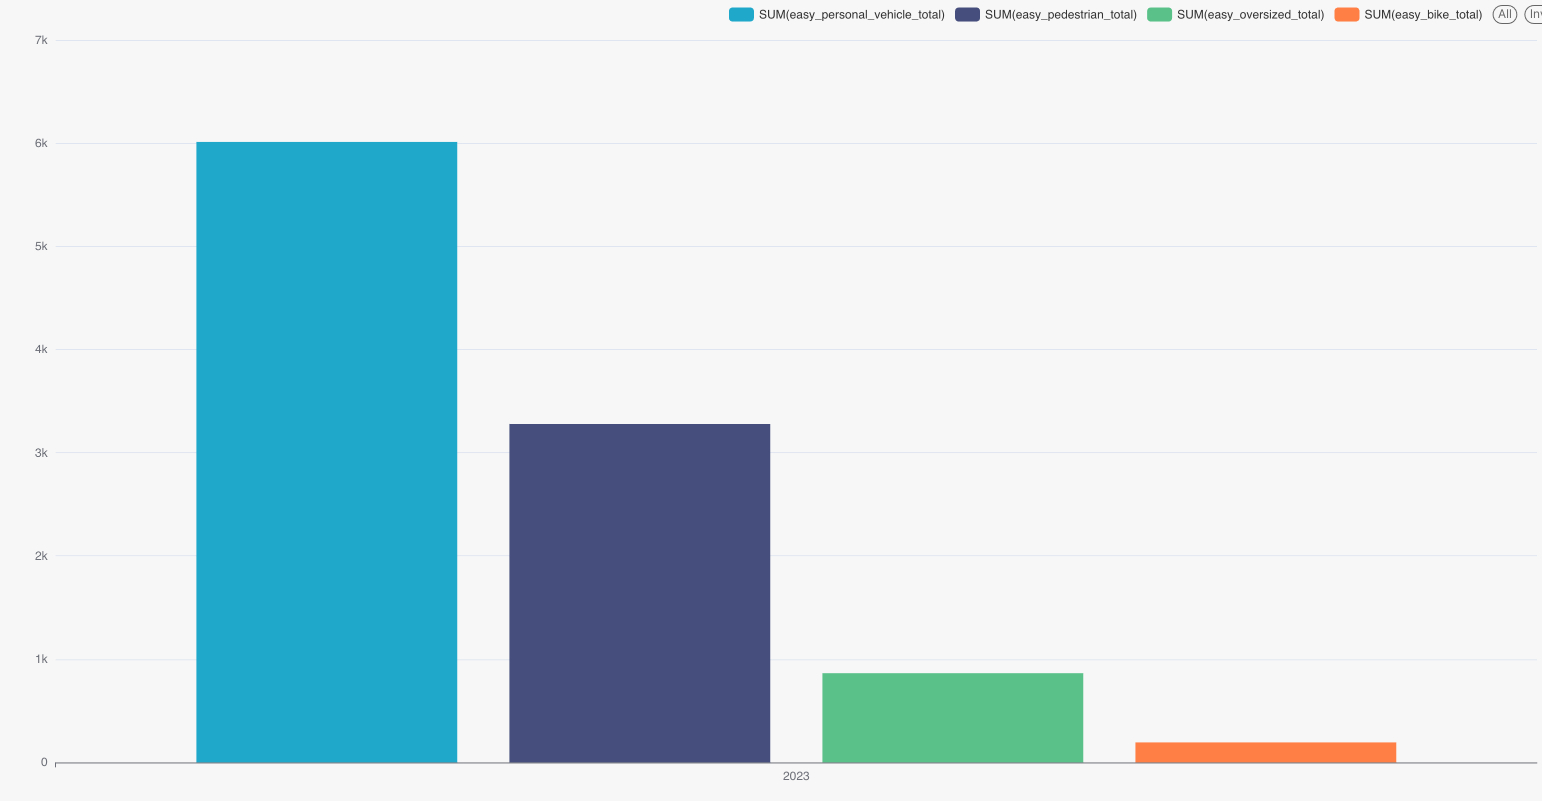
We found the following:
| Movements recorded | |
| Movements counted on Dunbar High Street between the Community Carrot and the Post Office | 10,000 |
| Active travel trips – just under | 3,500 |
| Personal car trips | 6,000 |
| Commercial (larger vehicles included camper vans and small vans / branded vehicles) | 850 |
| These converted into: | |
| Hourly average bike trips: 13; pedestrians: 217; motor cars : 402; and commercial vehicles: 57 | |
| Daily average bike trips: 154; pedestrians: 2,605; motor cars : 4,824; and commercial vehicles: 685 | |
| In other words there are twice as many car movements as pedestrians and bikes | |
| But this doesn’t tell us exactly how many use active travel exclusively, as many pedestrian trips will be multi modal, which could mean that that the number of ratio of active travel trips is smaller still. | |
| Counts undertaken | |
| 37 counts altogether on 21 different days | |
| Average count time 21m | |
| Range from 2m to 30m, a limited # under 10m are best excluded (these were interrupted counts) | |
| We aimed for at least 200 movements or a count time of 20m | |
| The period covered was from August 15th to September 26th | |
| Hours covered from 7am to 7pm with 2 counts per hourly slot | |
| Minutes surveyed | 783.6 |
| Hours surveyed | 13.1 |
| Further development | |
| A bit further work is required to improve the survey model e.g. to ensure consistency (e.g. commercially branded vehicles were classed as oversized; cyclists on pavements were enumerated cyclists) | |
| But essentially between 2 and 4 20 minute samples for each hour window in the times of interest should give a reasonably indicative picture, indicatively over 12 hours | |
| Rain, Wind and poor weather will depress total numbers and exaggerate the ratio or motorised to active travel modes | |
| Active travel tends to be lowest on Sundays, early morning and in the evening, when the convenience takeaway economy takes over – mainly car based | |
| Explore the data yourself here: | |
| https://superset.counterpointapp.org/explore/?form_data_key=zEH-UcWCoxJ1E7NER06Kaxc-wM8OYW6tVSBabXV3GcIIVkRmuHarCTIelqvoAJAX&slice_id=1119 | |
You must be logged in to post a comment.